
 EN
EN
 ar
ar bg
bg hr
hr cs
cs da
da nl
nl fi
fi fr
fr de
de el
el hi
hi it
it ko
ko no
no pl
pl pt
pt ro
ro ru
ru es
es sv
sv tl
tl iw
iw id
id lv
lv lt
lt sr
sr sk
sk sl
sl uk
uk vi
vi et
et hu
hu th
th tr
tr fa
fa ms
ms hy
hy ka
ka ur
ur bn
bn mn
mn ta
ta kk
kk uz
uz ku
ku
semiconductor based temperature sensors
Kingmach semiconductor based temperature sensors covers the site-condition layer of structural and geotechnical monitoring. It records the environmental forces and operating conditions that often explain why a structural sensor changes. Rainfall can precede slope movement or seepage; soil wetness can show whether water has reached a sensitive layer; temperature can affect strain, expansion, and sensor behavior; humidity can reveal cabinet and tunnel risks; wind can explain vibration, pressure, and access constraints. A useful description of this category should therefore start with the monitoring problem. The equipment is not installed to fill a dashboard with weather values. It is installed so engineers can compare conditions with settlement, displacement, tilt, load, vibration, strain, inspection notes, and maintenance actions. When these records share time stamps and point names, the owner can see both the trigger and the response. That makes abnormal-event review faster and helps long-term reports distinguish seasonal patterns from real deterioration.
If the reading seems unusual, the team should check the physical condition of the station before drawing conclusions about the asset. Blockage, poor exposure, loose wiring, water entry, and changed surroundings can all create misleading patterns.
A practical report links the condition value with time, place, and action. It should help a reviewer decide whether to keep observing, inspect the field point, compare nearby instruments, or record the event as normal site behavior.
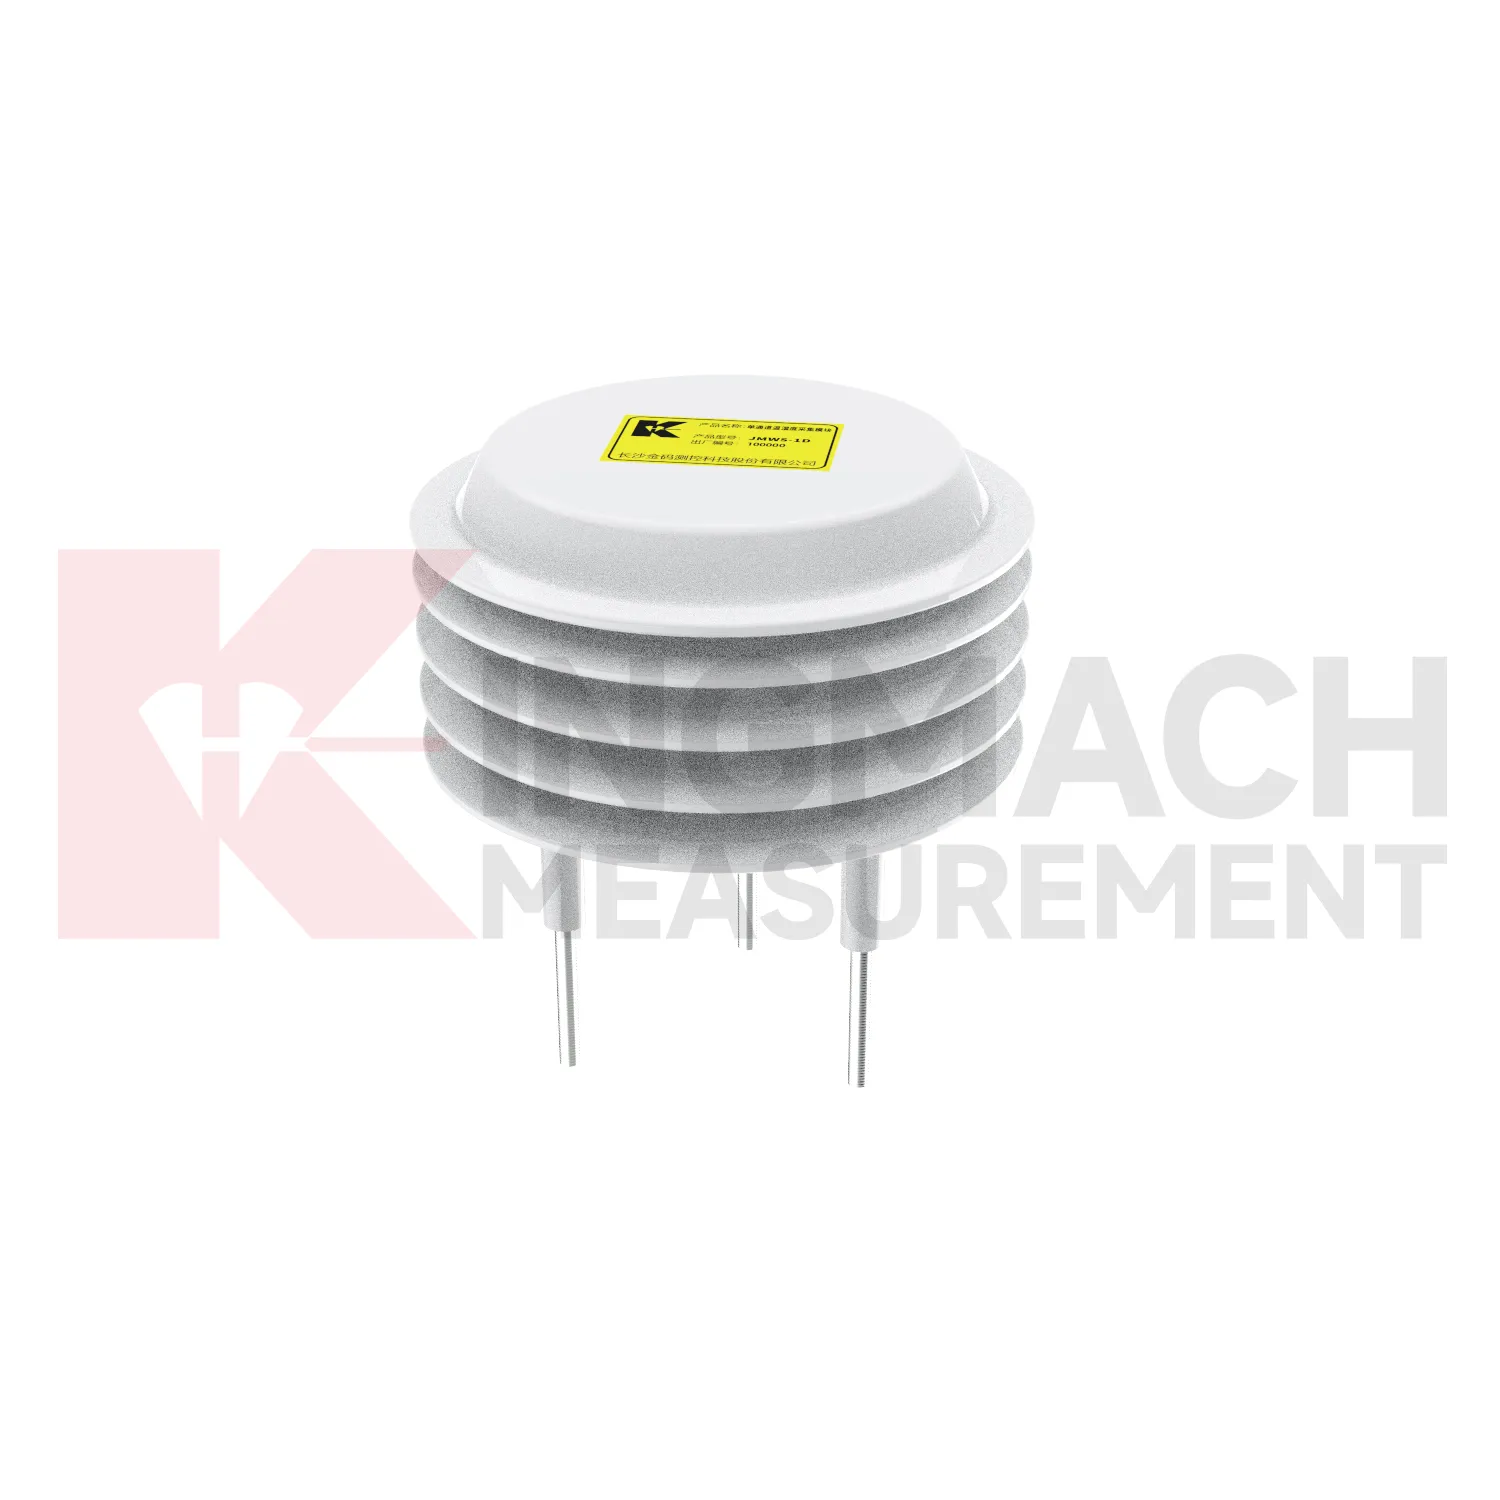
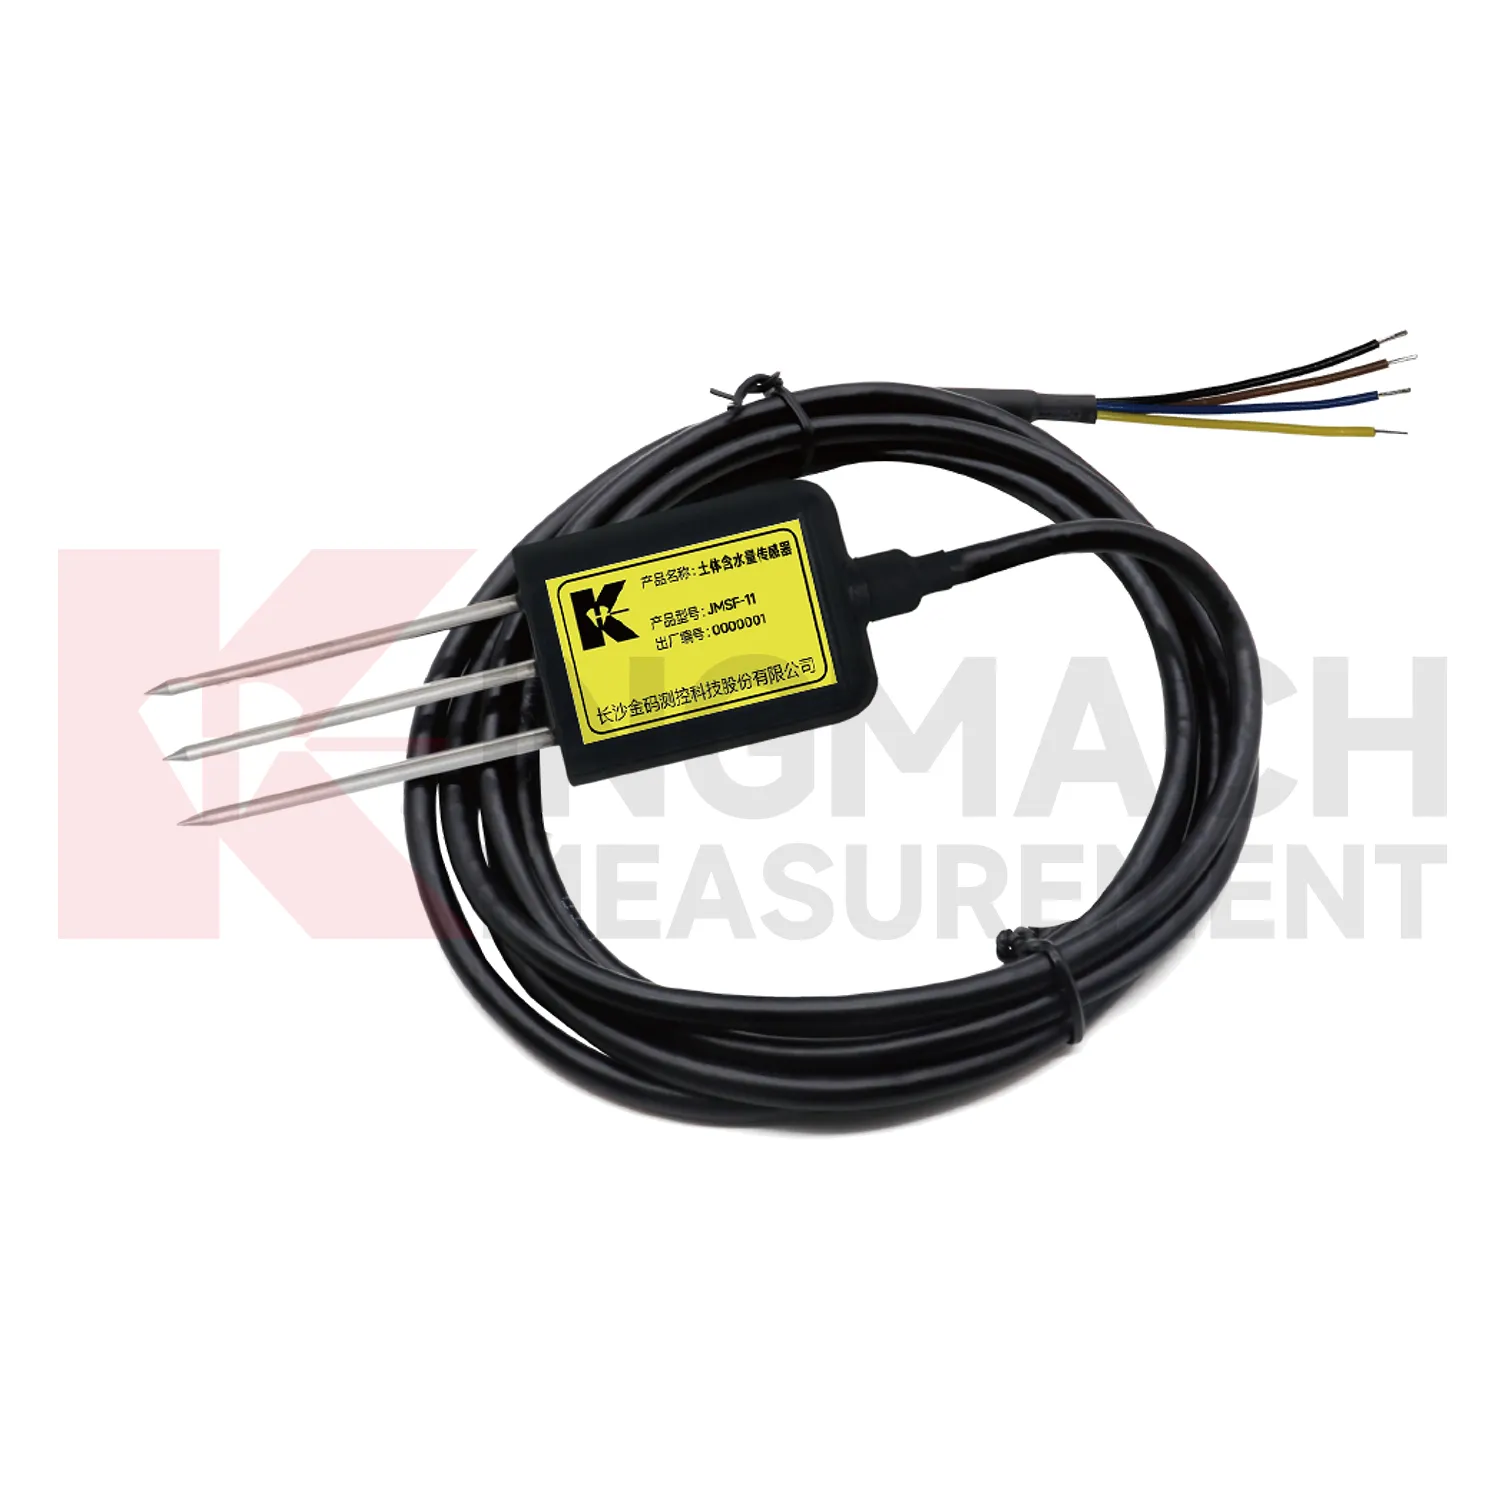
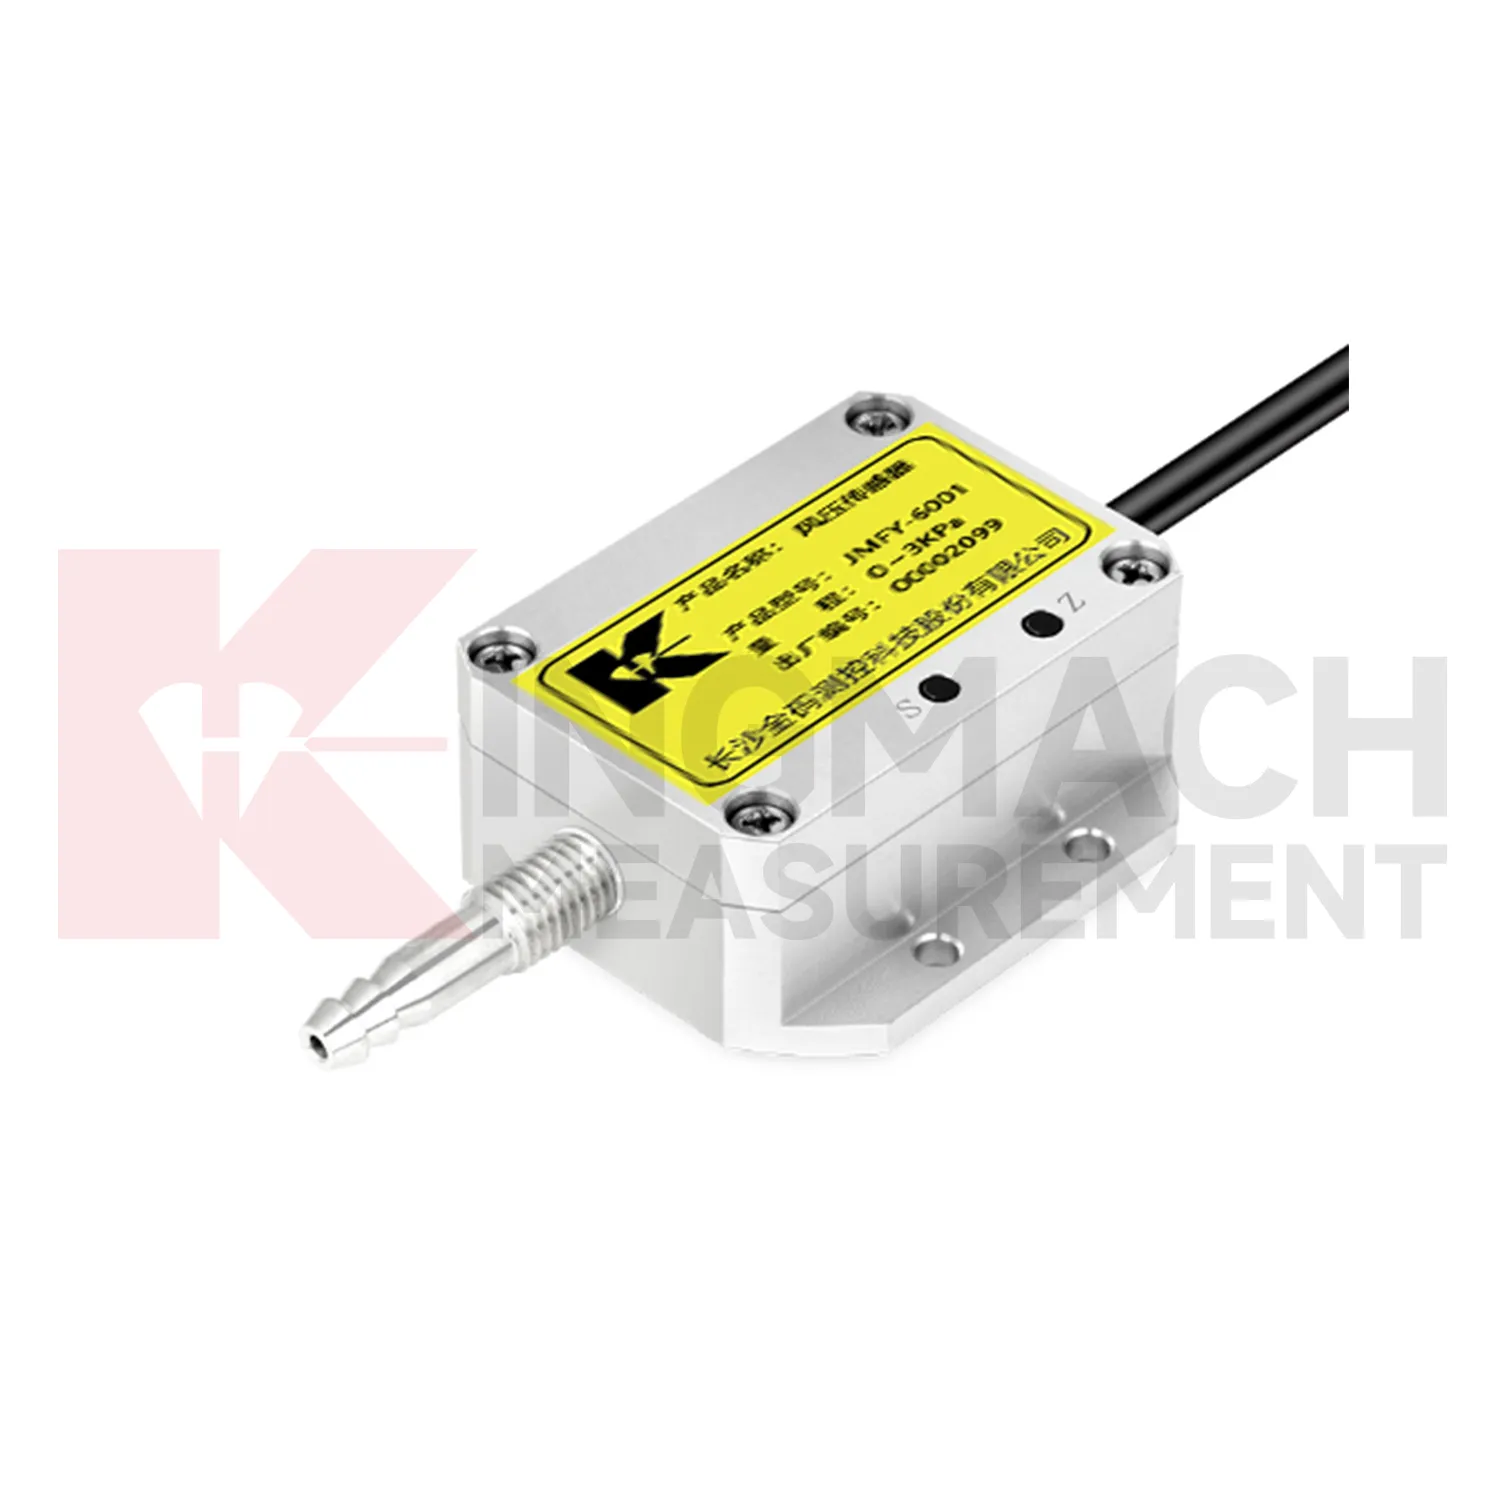
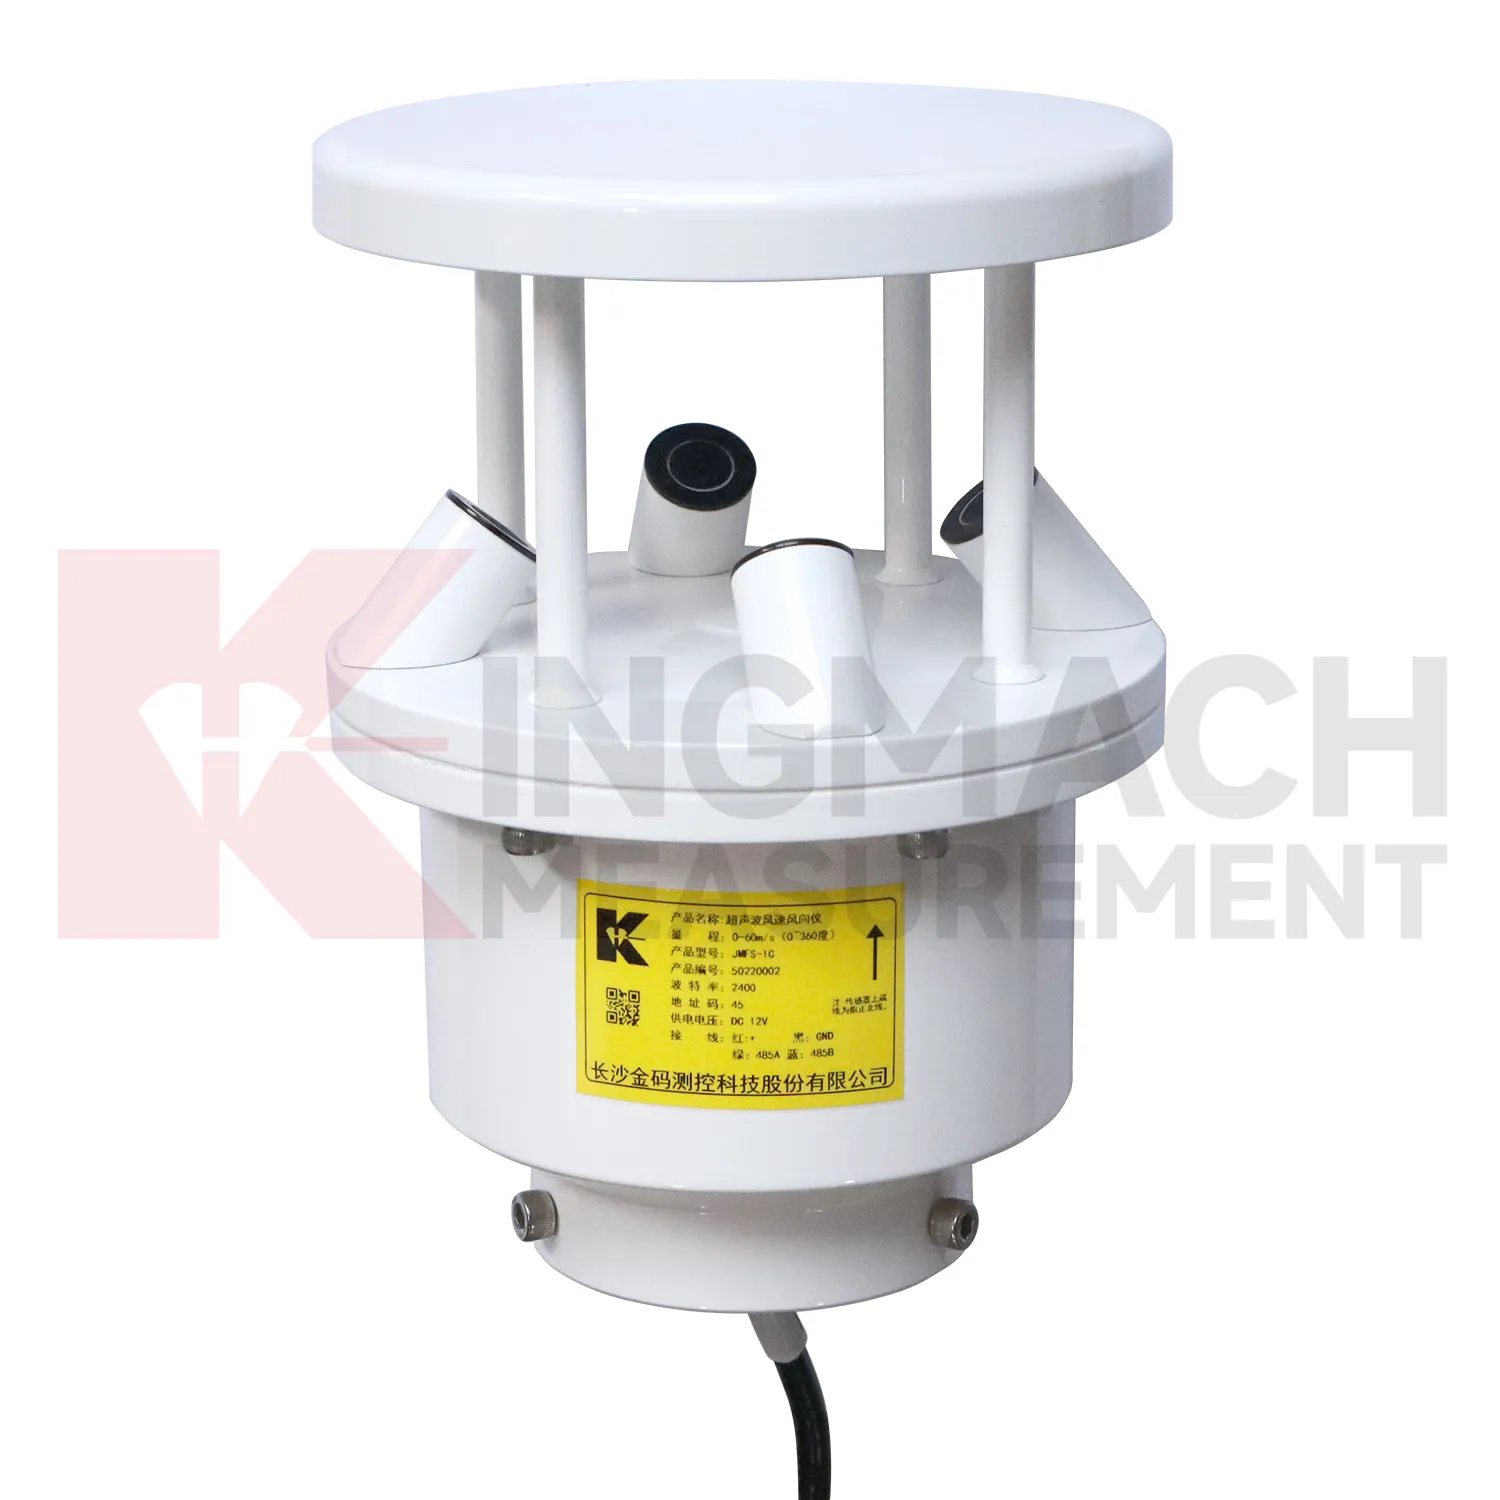
Application of semiconductor based temperature sensors
Wind towers and tall structures use Kingmach semiconductor based temperature sensors to compare exposure with structural behavior and maintenance needs. Wind, temperature, humidity, and pressure conditions can influence vibration, tilt, access decisions, cable routing, and enclosure life. An environmental station should avoid local shielding where possible and should be mounted with stable hardware that will not create its own movement. The record is useful when reviewed with acceleration, tilt, strain, foundation settlement, and maintenance events. If a tower shows unusual motion, the team can check whether the timing matches wind direction, gust activity, equipment operation, or service work. Long-term environmental records also help plan inspections after severe weather, icing, salt exposure, or repeated high-wind periods.
A good review habit is to compare the condition channel with the nearest asset behavior instead of reading it as a standalone weather value. That keeps the record tied to slope movement, bridge response, tunnel equipment, dam seepage, drainage behavior, or cabinet reliability.
The installation file should explain why the location represents the monitored area. If the point is sheltered, shaded, exposed, buried, elevated, or placed inside an enclosure, that fact changes how later readings should be understood by maintenance staff.
During abnormal events, the first question is not only whether the value crossed a limit. The reviewer should ask what changed around the site, whether the related structure reacted, and whether a field inspection confirmed the same pattern.
The future of semiconductor based temperature sensors
Compatibility will remain a future requirement for Kingmach semiconductor based temperature sensors. Environmental stations often combine different signal paths, power needs, units, enclosures, cables, and data logger settings. If these details are not planned, installation becomes slow and later replacement becomes confusing. Future specifications should define data output, unit conversion, channel capacity, sampling plan, power source, protection needs, maintenance access, and platform display before installation begins. Clear compatibility keeps environmental data usable through commissioning, operation, repair, and handover. It also prevents a monitoring station from becoming dependent on undocumented field improvisation.
Future compatibility work should also cover spare parts and replacement paths. If a station must be repaired after years of service, the owner should know which signal type, unit conversion, connector style, enclosure space, and platform channel are required before field crews arrive.
This planning reduces downtime during storms, construction stages, and maintenance windows. It also helps teams replace one component without changing the meaning of the environmental record or breaking the link to structural channels.
Care & Maintenance of semiconductor based temperature sensors
Power and enclosure care keep Kingmach semiconductor based temperature sensors reliable in harsh field conditions. Inspect power supplies, terminals, grounding, surge protection, cabinet seals, cable glands, drainage, insect entry, corrosion, and labels. Outdoor stations face rain, dust, heat, cold, wind, and accidental impact. Underground stations face moisture, limited ventilation, and cable congestion. A station may have protected instruments but still fail because a cabinet entry leaks or a terminal loosens. After storms, construction work, or equipment maintenance, record the enclosure condition and first stable data. This makes it easier to tell whether a later change came from the environment, the asset, or the station hardware.
If the reading seems unusual, the team should check the physical condition of the station before drawing conclusions about the asset. Blockage, poor exposure, loose wiring, water entry, and changed surroundings can all create misleading patterns.
A practical report links the condition value with time, place, and action. It should help a reviewer decide whether to keep observing, inspect the field point, compare nearby instruments, or record the event as normal site behavior.
Kingmach semiconductor based temperature sensors
The data chain behind Kingmach semiconductor based temperature sensors should be as clear as the sensors themselves. Environmental channels may use different signal types, units, update intervals, and power needs. If the channel names are weak, a report may confuse rainfall with another station, wind direction with wind speed, or room humidity with cabinet humidity. Each point should have a unit, location, data path, inspection interval, and linked structural record. This prevents environmental data from being collected but ignored. During an alarm, the team should be able to open one timeline and see the condition change, the structural response, and the maintenance note. That is where environmental monitoring becomes practical.
During abnormal events, the first question is not only whether the value crossed a limit. The reviewer should ask what changed around the site, whether the related structure reacted, and whether a field inspection confirmed the same pattern.
Long-term value comes from consistency. A channel that keeps the same location, unit, maintenance history, and linked asset record can support seasonal comparison, post-storm review, and handover between construction and operation teams.
FAQ
Q: How does rainfall data support slope review?
A: Rainfall gives the timing and intensity background for movement, seepage, wetting, and field inspections after storms.
Q: Why measure soil wetness as well as rainfall?
A: Rainfall stays at the surface record, while buried wetness shows whether water reached the soil depth that may influence movement.
Q: How does wind data support bridge or tower monitoring?
A: Wind direction and exposure can explain vibration, deflection, access difficulty, and weather-driven structural response.
Q: Why monitor humidity underground?
A: Humidity can affect cabinets, connectors, corrosion, sensor stability, and operating conditions in tunnels, subways, mines, and equipment spaces.
Q: How does temperature help interpretation?
A: Temperature helps reviewers separate thermal behavior from structural change in strain, displacement, cabinet condition, or material response.
Long-term value comes from consistency. A channel that keeps the same location, unit, maintenance history, and linked asset record can support seasonal comparison, post-storm review, and handover between construction and operation teams.
Reviews
David Wilson
We purchased displacement transducers and settlement sensors, and the quality exceeded our expectations. Easy installation and reliable performance.
Ryan Lewis
Fast delivery and excellent product quality. The accelerometers and tiltmeters are highly reliable. Strongly recommend this company.
Latest Inquiries
To protect the privacy of our buyers, only public service email domains like Gmail, Yahoo, and MSN will be displayed. Additionally, only a limited portion of the inquiry content will be shown.
Olivia***@gmail.comUnited States
Hello, we are currently sourcing high-precision strain gauges and load cells for a bridge monitoring...
Charlotte***@gmail.comUnited Arab Emirates
Hi, we require instrumentation cables suitable for harsh environments. Could you advise on specifica...
Related product categories
- platinum resistance temperature sensor
- resistive temperature sensors
- resistance type temperature sensors
- resistance temperature sensors
- temperature sensor resistance
- ambient temperature sensor resistance
- resistance of temperature sensor
- Temperature and Humidity Acquisition Module
- water temperature sensor resistance
- soil moisture sensor
- soil moisture sensors
- capacitive soil moisture sensor