 ar
ar bg
bg hr
hr cs
cs da
da nl
nl fi
fi fr
fr de
de el
el hi
hi it
it ko
ko no
no pl
pl pt
pt ro
ro ru
ru es
es sv
sv tl
tl iw
iw id
id lv
lv lt
lt sr
sr sk
sk sl
sl uk
uk vi
vi et
et hu
hu th
th tr
tr fa
fa ms
ms hy
hy ka
ka ur
ur bn
bn mn
mn ta
ta kk
kk uz
uz ku
ku
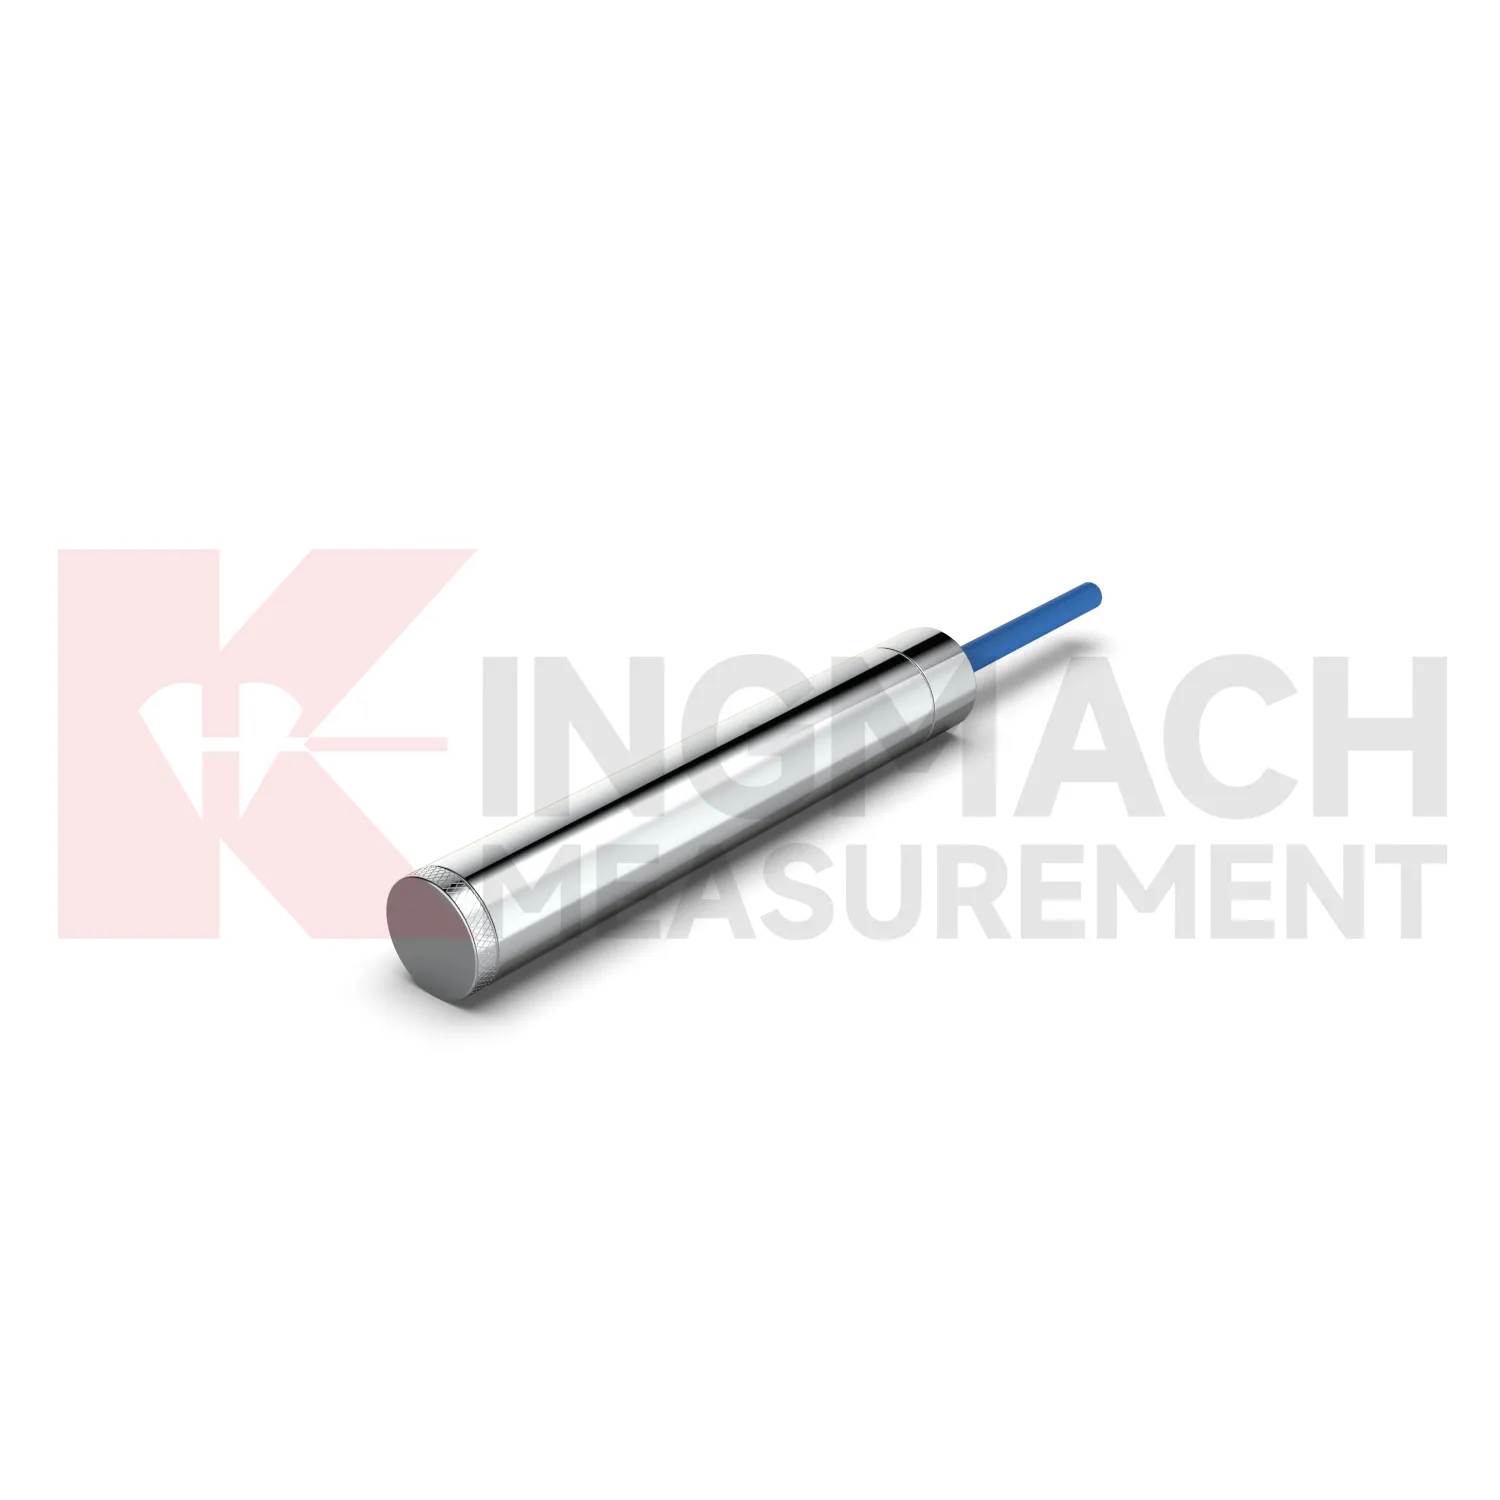
load cell connection diagram
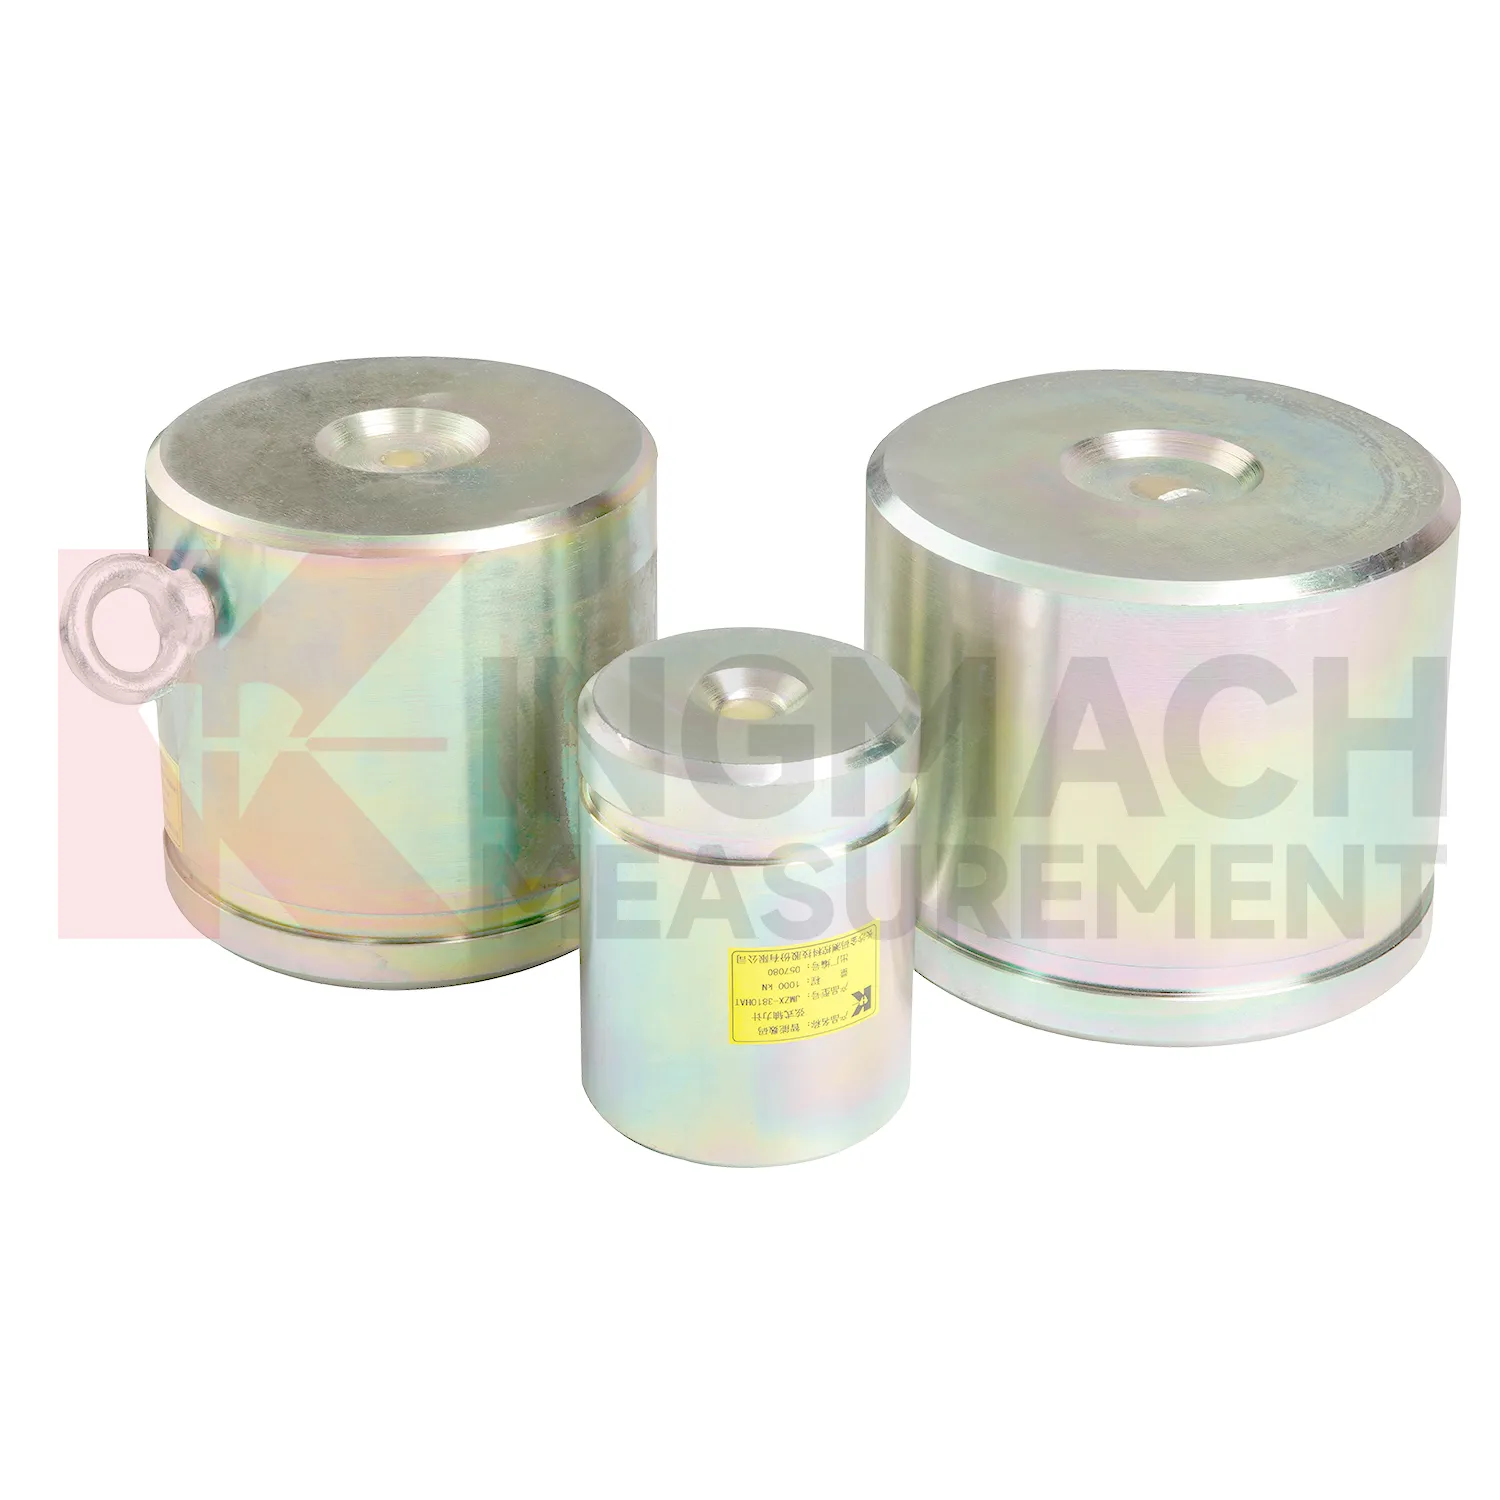
Kingmach load cell connection diagram is suitable for projects that need both high capacity and traceable readings. The solid JMZX-35XXHAT line lists a 0.5%FS precision rating, a -30°C to 80°C temperature range, and overload information up to 20 to 50%F.S. for range overload and 300 to 400%F.S. for failure overload. The hollow JMZX-3XXXHAT line lists a 50 year design life, waterproof durability, digital output, and storage for 800 measurement records. The axial force JMZX-38XXHAT line lists 1 MPa waterproofing and direct kN display. Together, these points support force measurement in bridges, buildings, railways, transportation, hydropower, dams, tunnels, and foundation pits. Kingmach also provides monitoring products beyond load measurement, allowing the force record to be compared with movement, pressure, and environmental data. That is useful when a load change needs to be judged against the wider behavior of the structure rather than treated as a disconnected alarm. Kingmach's product pages also refer to industry certifications such as GB/T 13606-2007 and DL/T 269-2022 on selected models. Such references help buyers request documentation that matches project acceptance procedures and owner audit needs. This helps avoid ordering a sensor that is strong enough on paper but difficult to seat, wire, read, or protect in the actual structure.
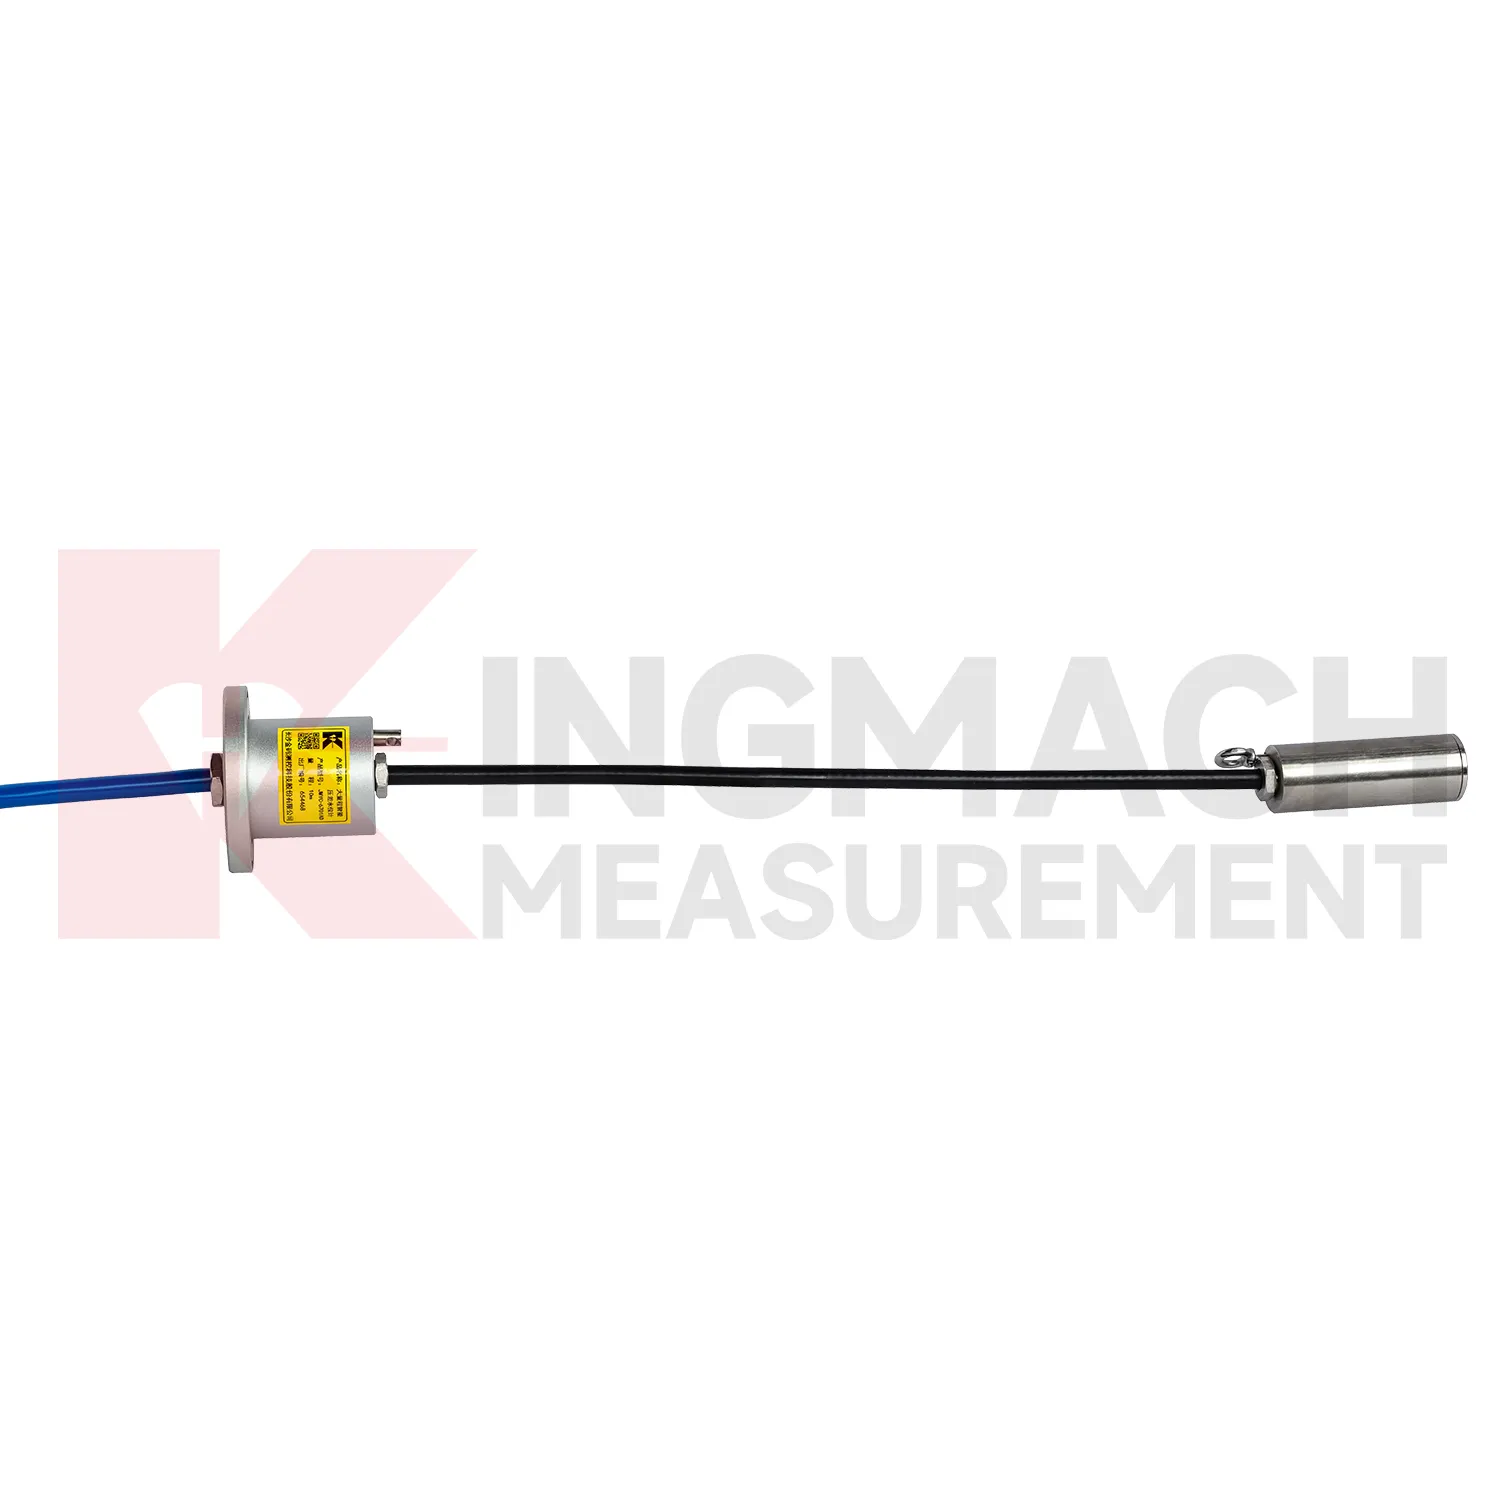
Application of load cell connection diagram
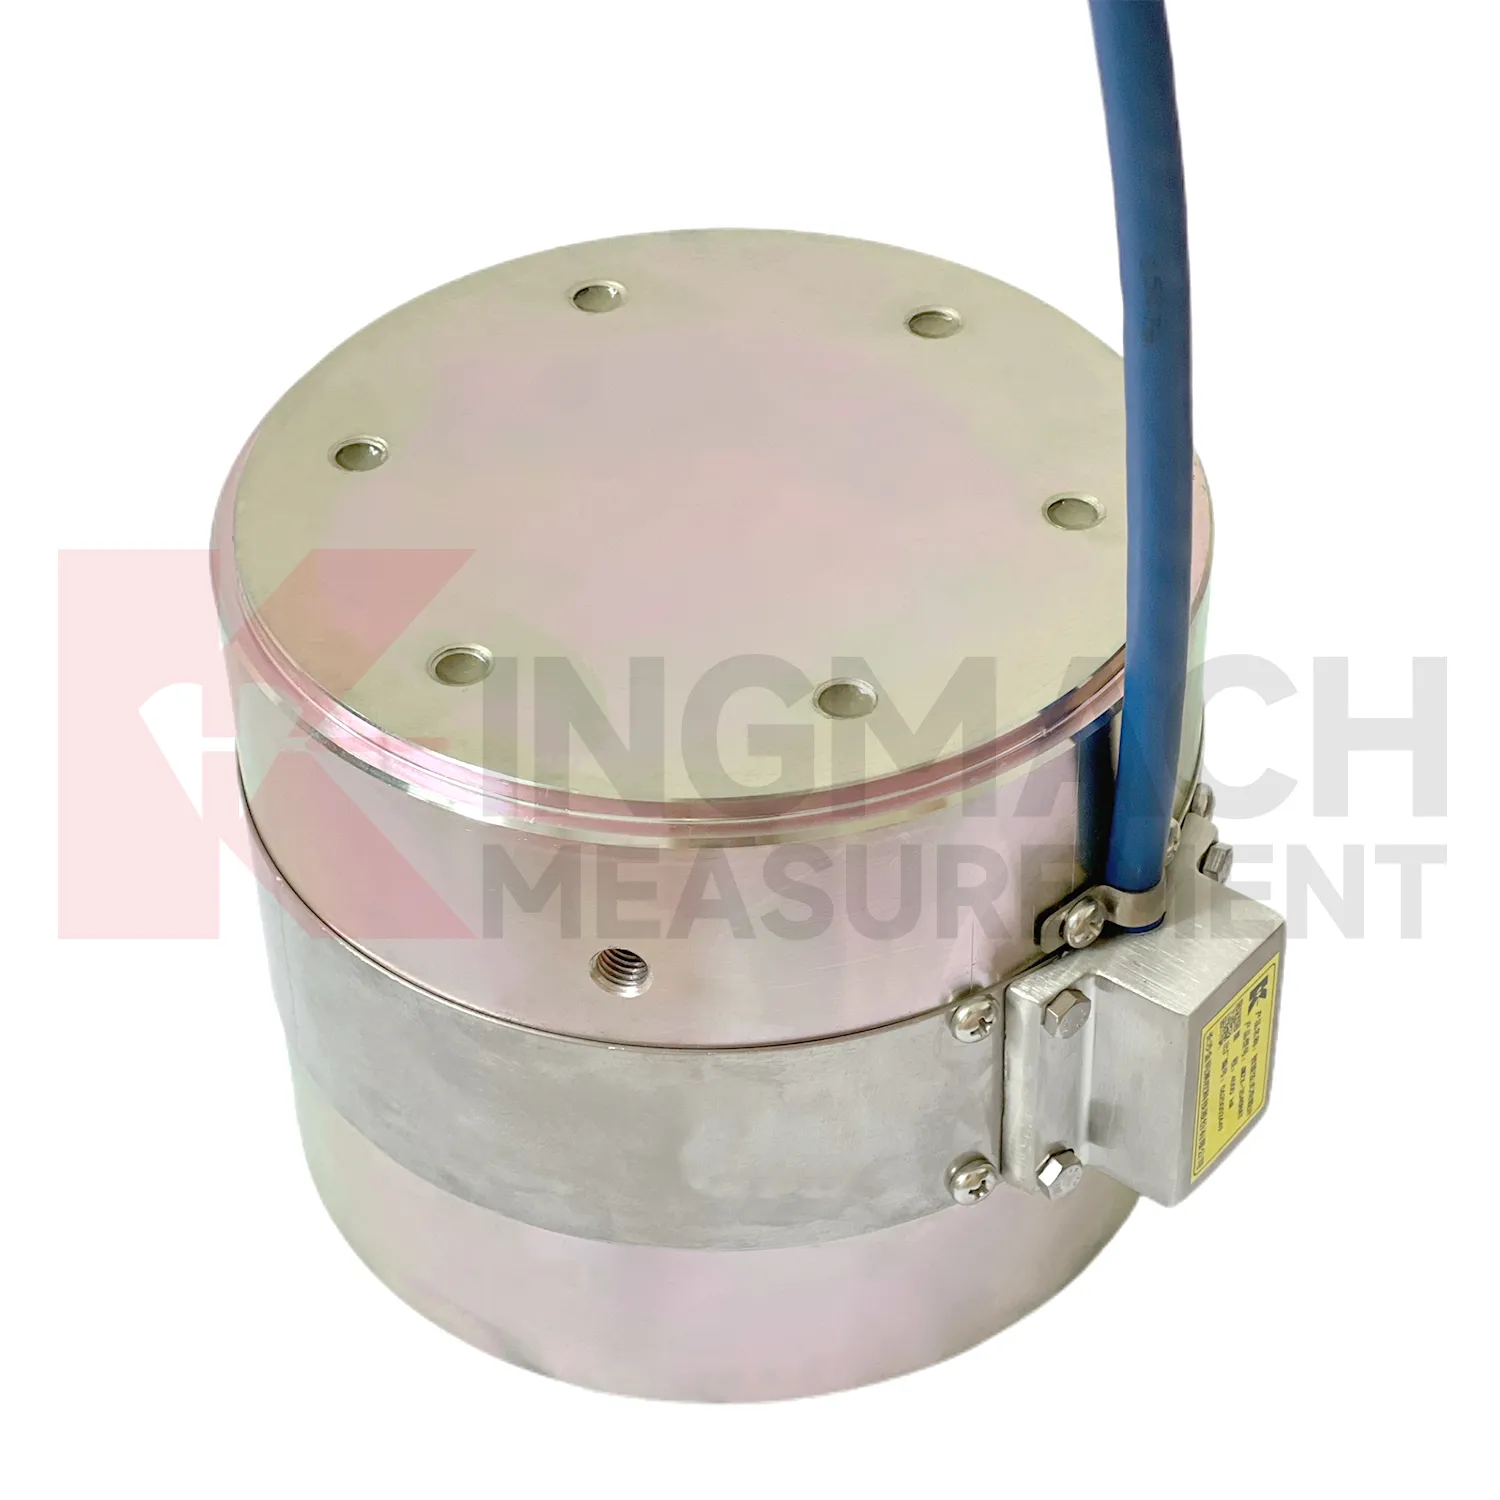
In slope, embankment, and retaining wall projects, load cell connection diagram helps monitor anchor force, slide resistant pile load, earth pressure, and stress change after rainfall or groundwater variation. The practical pain point is that visible slope movement may arrive late, while load and pressure trends may start earlier. Earth pressure cells in the Kingmach range are listed from 0.3 MPa to 8 MPa, with 0.001 MPa resolution, 0.5%FS pressure accuracy, and ±0.5°C temperature accuracy. Hollow load cells for anchor force cover 500 kN to 8000 kN and include temperature correction and waterproof construction. These parameters support long term points in buried, wet, or exposed conditions. Force data should be reviewed with inclinometer, settlement, water level, rainfall, and crack observation records. If anchor force drops while displacement increases, the project team has a different problem than a temporary pressure rise after rain. The instrumentation plan should therefore connect each load point to the ground behavior it is meant to explain. On slopes, cable routes should be protected against rockfall, drainage works, vegetation clearing, and surface runoff. Those mundane details matter because a broken cable can look like a dramatic geotechnical event if the hardware is not inspected first.
The future of load cell connection diagram
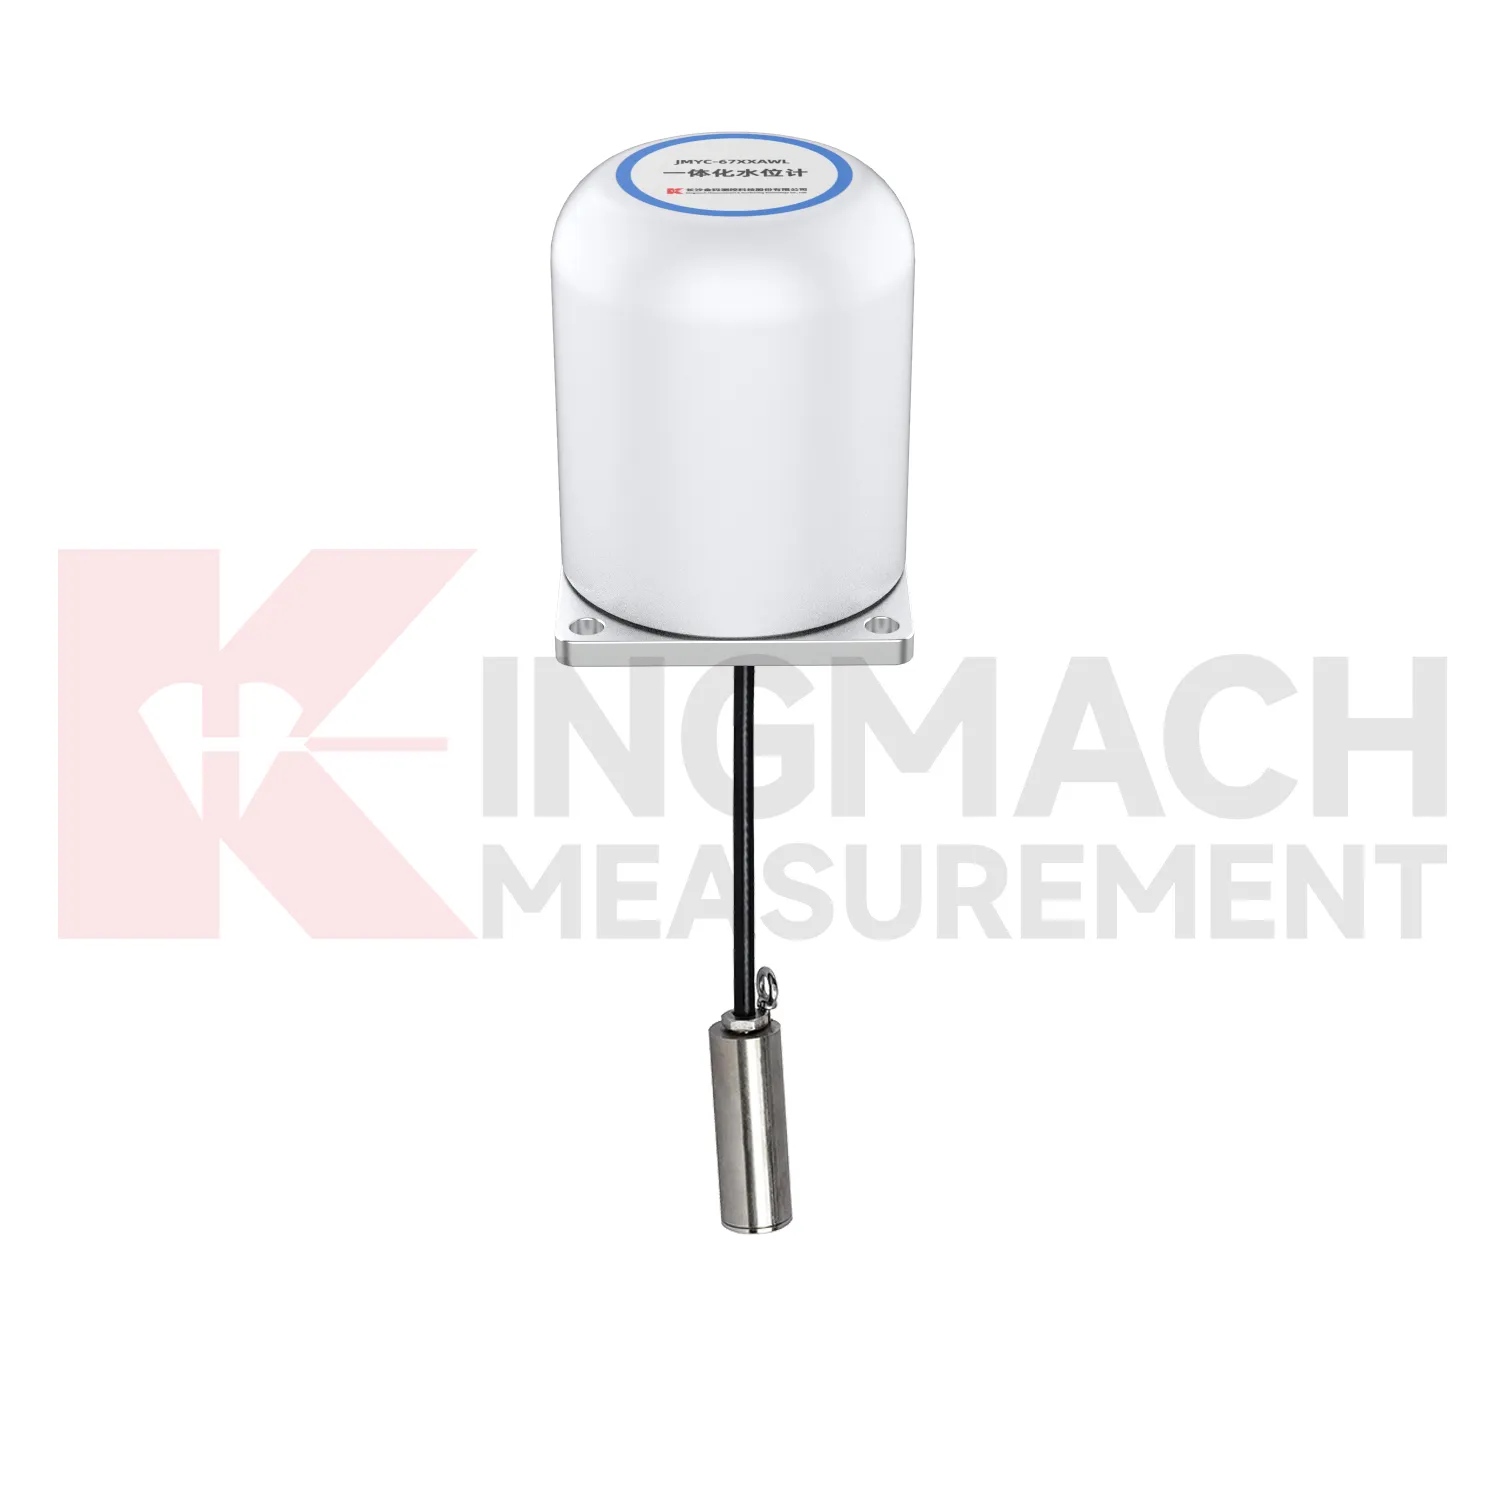
Geotechnical use of load cell connection diagram will become more connected to environmental monitoring. Earth pressure cells with 0.3 MPa to 8 MPa ranges and 0.001 MPa resolution can already record soil or contact pressure, but future value comes from reading pressure with rainfall, groundwater, seepage, settlement, and slope movement. A pressure increase after rain may be acceptable in one slope and worrying in another, depending on the ground model and drainage condition. Digital twins can handle that comparison if the data is clean enough. Kingmach's wider catalog, including piezometers, water level meters, settlement sensors, tiltmeters, data loggers, and visualization software, supports that direction. Wireless communication will help remote slopes and embankments, while wired systems may remain preferable for buried points with long service expectations. Future standards for monitoring reports will likely ask for more traceable context around each reading, including sensor range, accuracy, calibration date, and installation depth. That connection makes trend review more useful after storms.
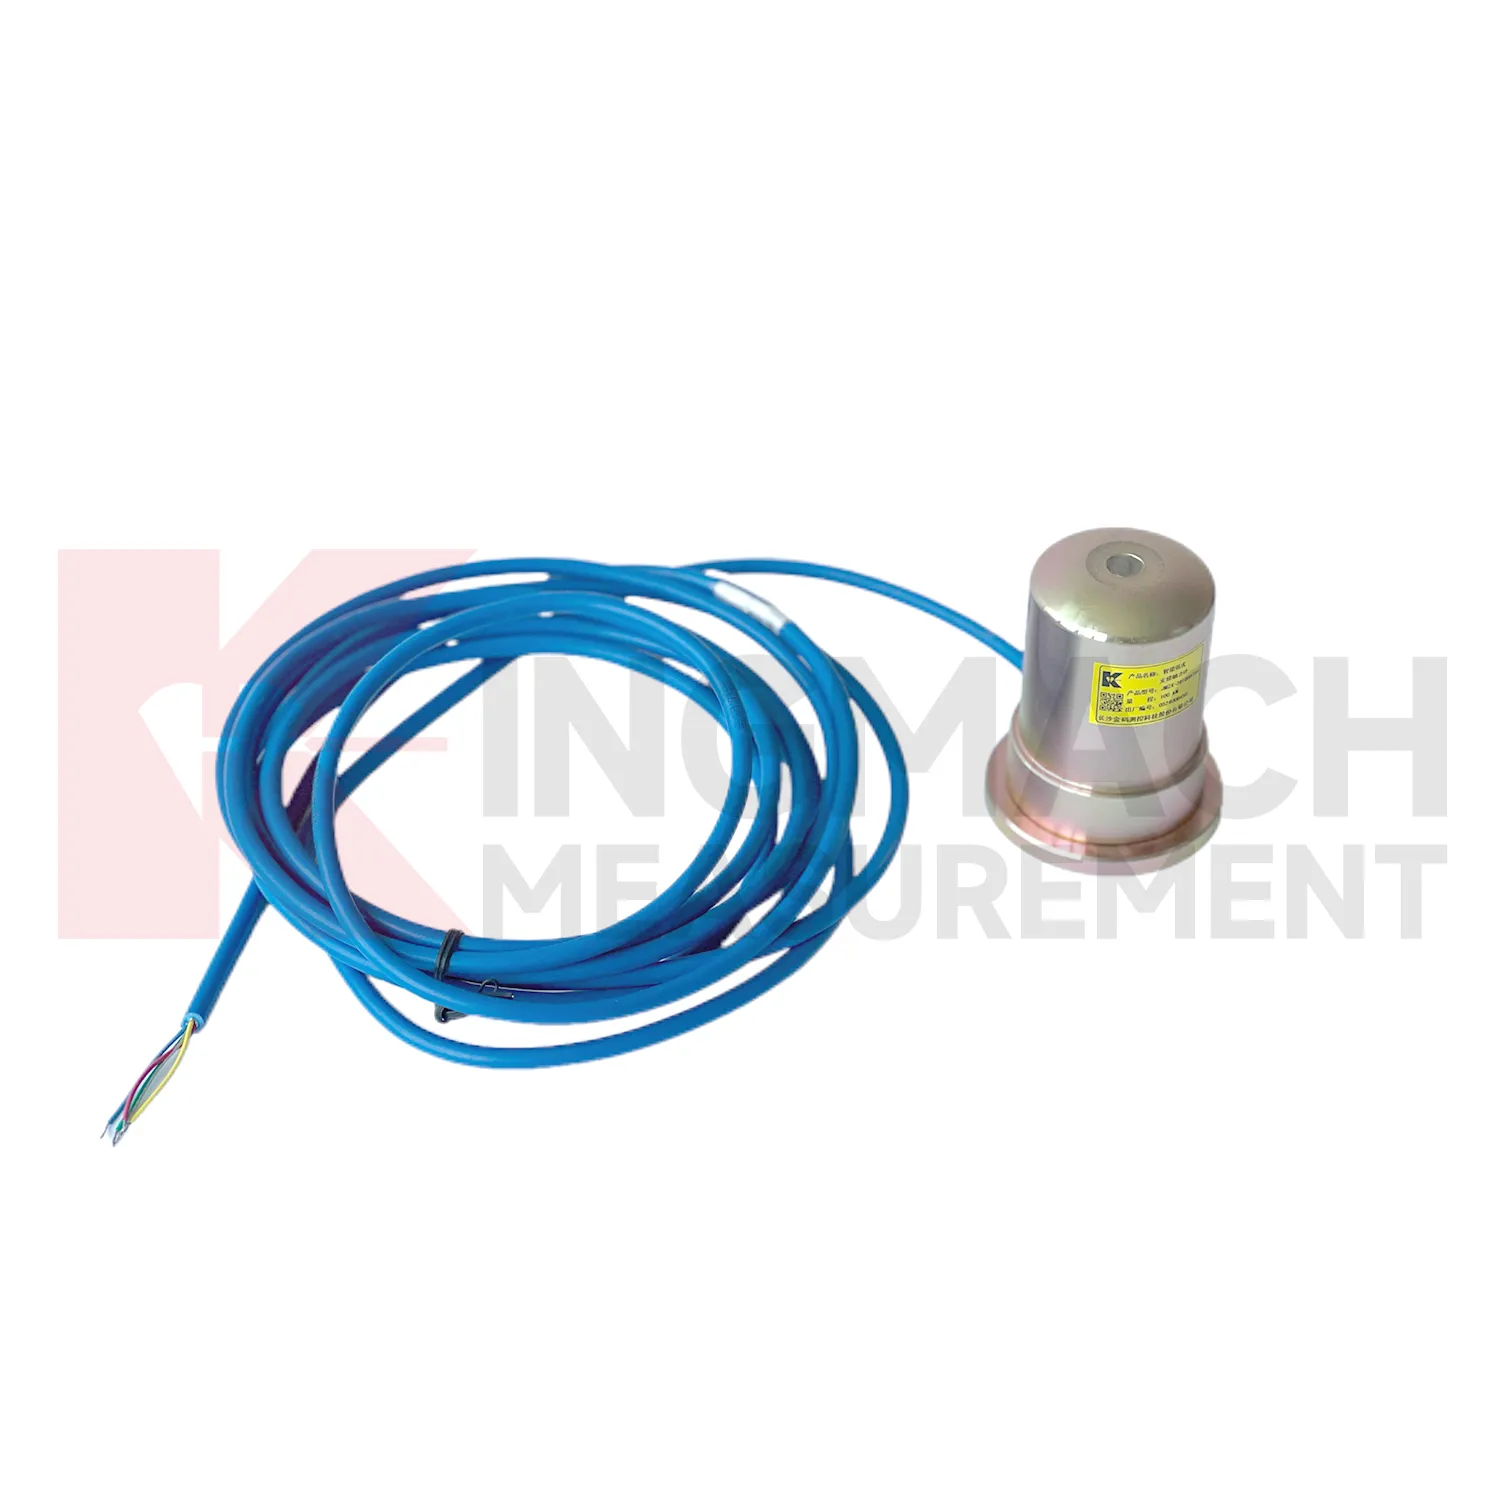
Care & Maintenance of load cell connection diagram
Care for load cell connection diagram should separate the installation stage from the service stage. At installation, the goal is mechanical correctness: centered loading, clean contact surfaces, adequate plate thickness, no side load, no cable strain, and a documented zero reading. The JMZX-38XXHAT axial force meter has a 1 MPa waterproof rating, but connector sealing and cable protection still need field attention. Solid load cells list -30°C to 80°C working temperature and 0.5%FS precision, so records should include temperature during important readings. During service, the goal changes to trend reliability. Check whether readings shift after construction stages, heavy rain, traffic opening, reservoir level change, or support adjustment. Keep calibration documents and channel names consistent across manual and automated systems. Where smart sensors store measurement records, download or archive data before maintenance work that might disturb wiring. Most field problems can be prevented by dry connectors, protected cables, clear labels, and routine comparison with nearby monitoring points.
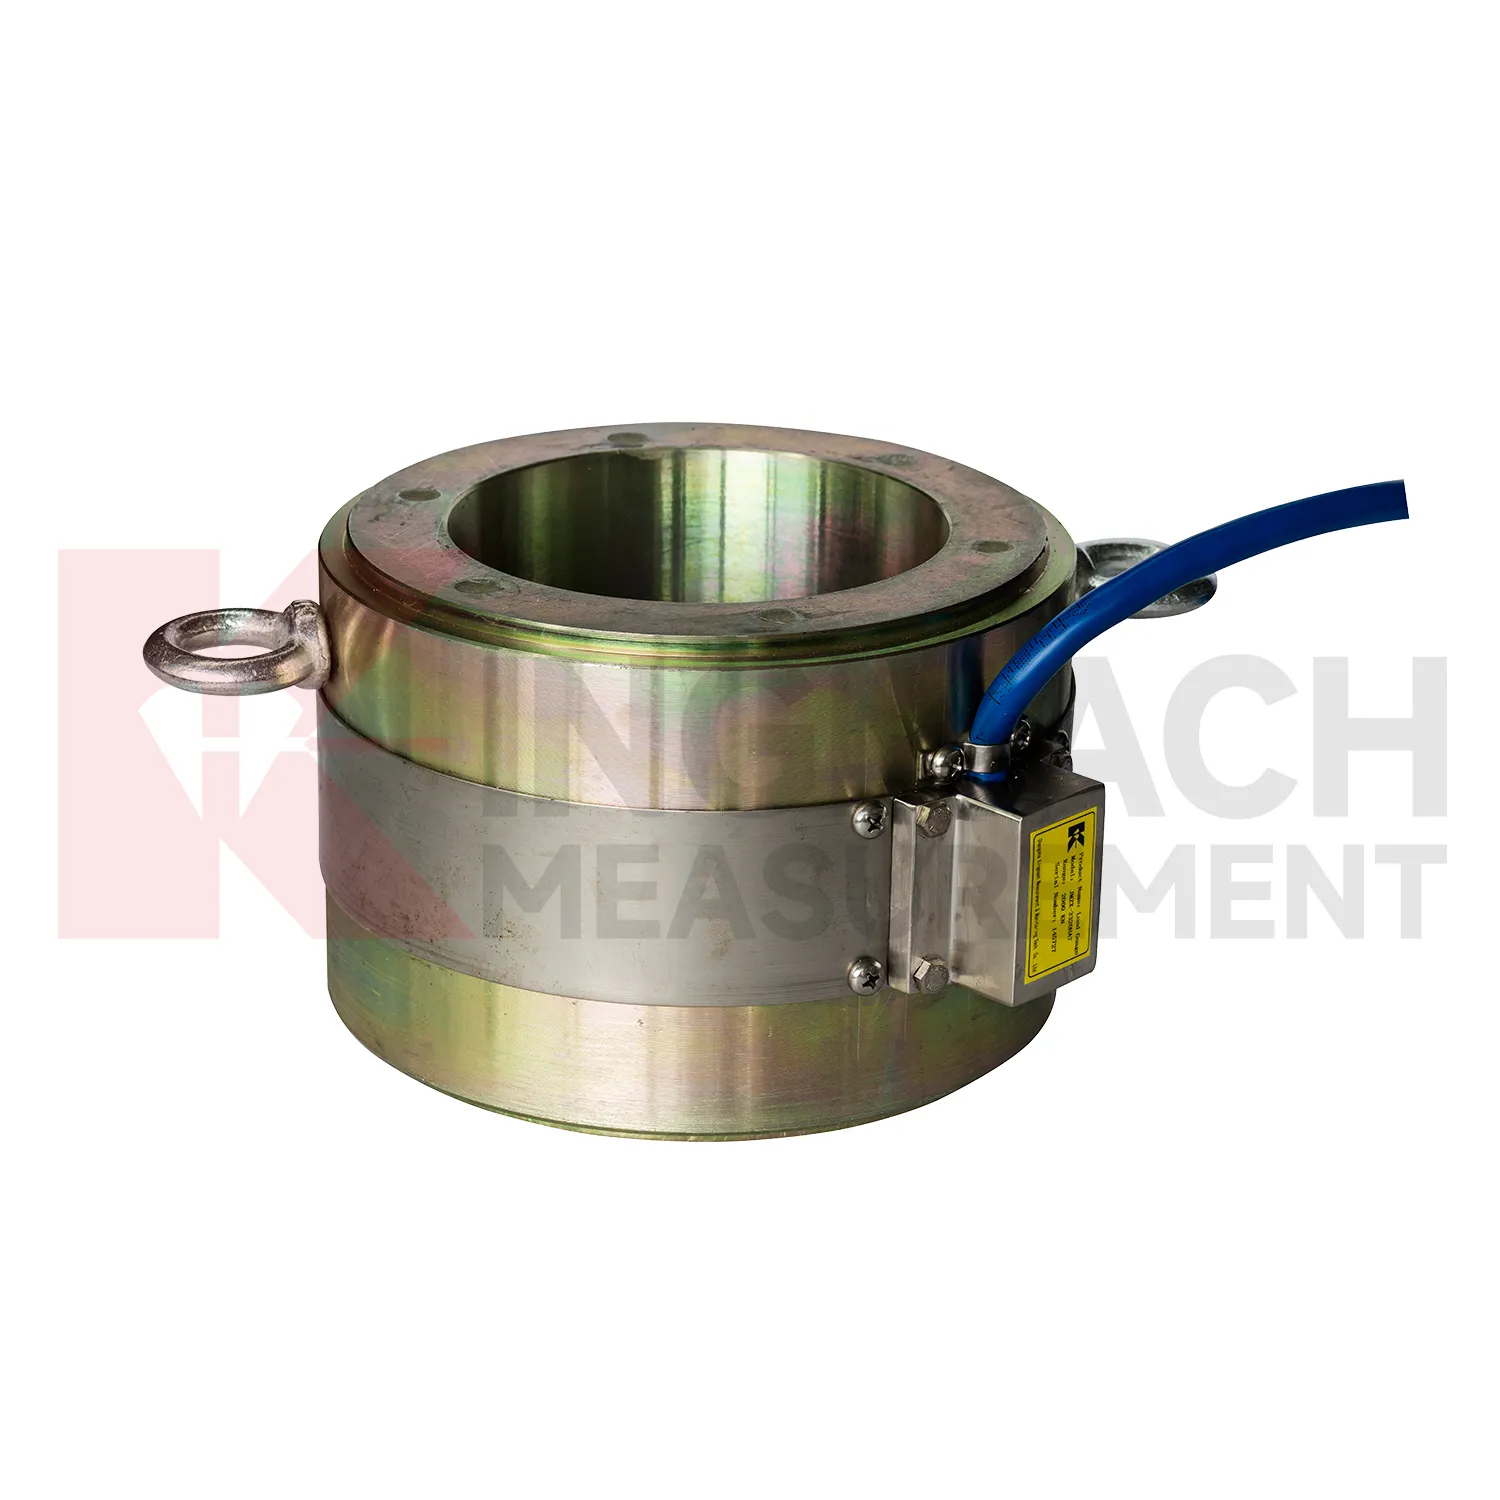
Kingmach load cell connection diagram
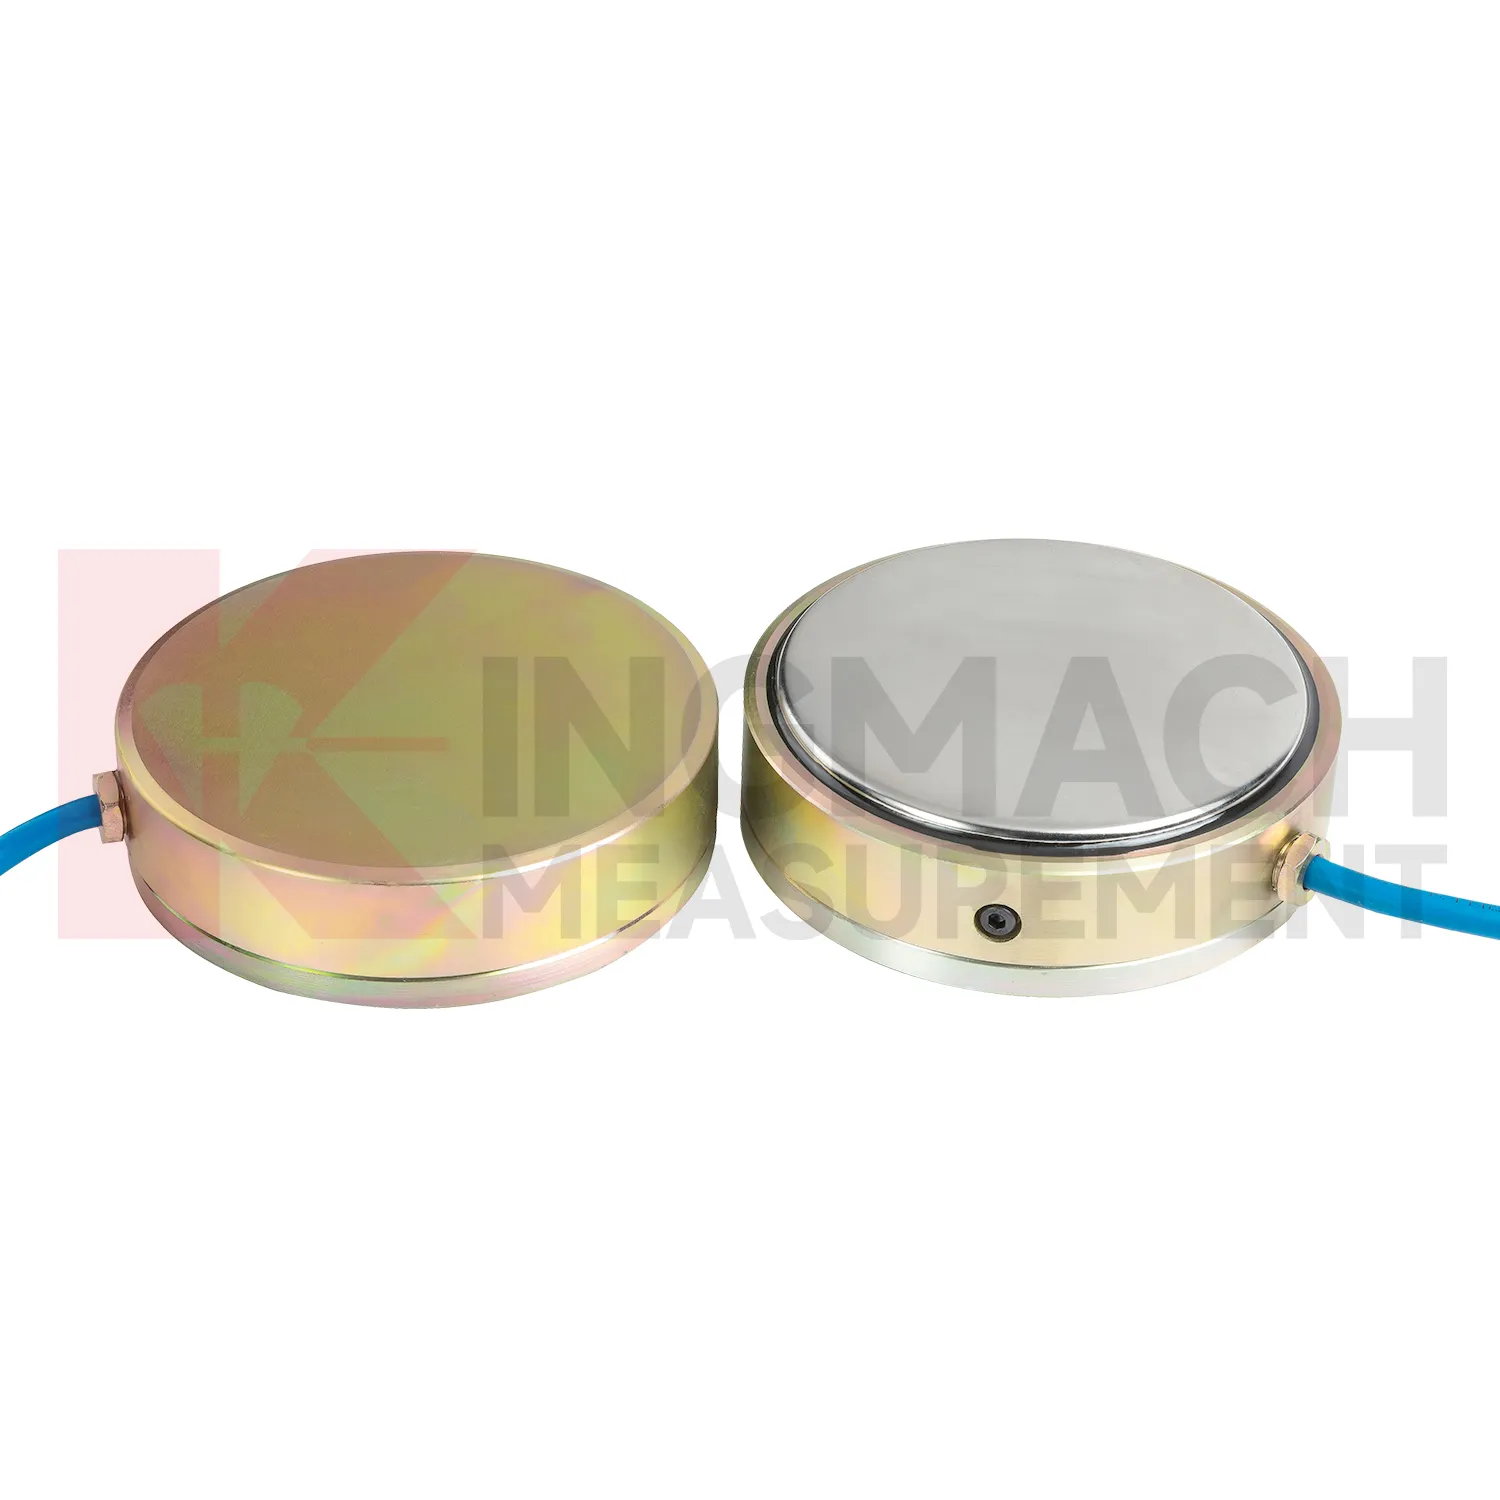
load cell connection diagram is often selected after a project team asks where force can change without being seen. In a tunnel, the answer may be the steel support. In a bridge, it may be a cable anchor or bearing. In a foundation pit, it may be a strut, anchor, or retaining wall contact zone. In a dam, it may be an anchor system affected by water level and temperature. Kingmach's monitoring product family allows these points to be linked with settlement sensors, displacement transducers, tiltmeters, piezometers, data loggers, and software platforms. That wider context matters because load change is rarely isolated. A rising force reading becomes more meaningful when it is checked against movement, pore pressure, and construction activity. A falling force reading may point to relaxation, seating loss, or damage near the bearing surface. The instrument gives the first clue, and the surrounding data explains it. It also makes abnormal values easier to discuss with designers, contractors, and maintenance teams.
FAQ
Q: What does load cell connection diagram do in a foundation pit or tunnel? A: It measures axial force in steel supports, anchor load, or pressure change as excavation and support stages progress. Q: Which Kingmach model fits steel support axial force? A: The JMZX-38XXHAT axial force meter is listed from 200 kN to 3000 kN, with 0.1 kN or 1 kN sensitivity and 0.5%FS accuracy. Q: Is it suitable for wet underground sites? A: The axial force meter lists a 1 MPa waterproof rating, but connector sealing and cable routing still need inspection. Q: Why is direct kN display useful? A: It reduces confusion because teams can read axial force directly instead of converting vibrating wire frequency on site. Q: What should trigger extra checks? A: Excavation step changes, rainfall, dewatering, support adjustment, sudden force jumps, or unstable channels.
Reviews
Michael Anderson
The strain gauges and load cells are extremely accurate and stable. They performed very well in our bridge monitoring project. Highly recommended!
Robert Taylor
The weir flow meter is well-built and delivers accurate measurements. Great value for water management applications.
Latest Inquiries
To protect the privacy of our buyers, only public service email domains like Gmail, Yahoo, and MSN will be displayed. Additionally, only a limited portion of the inquiry content will be shown.
Sophia***@gmail.comUnited Kingdom
Good day, we need environmental monitoring sensors including temperature, humidity, and wind sensors...
Olivia***@gmail.comUnited States
Hello, we are currently sourcing high-precision strain gauges and load cells for a bridge monitoring...